How to Use Workflow Dashboards for Leadership Visibility
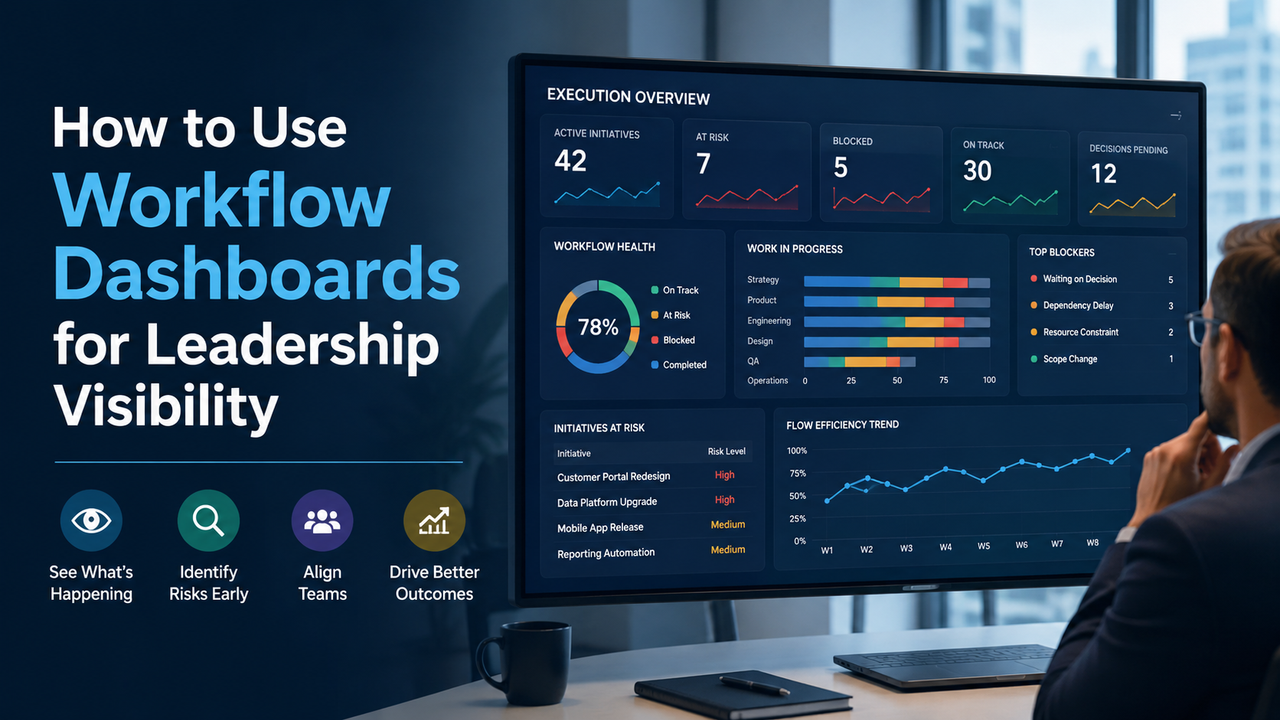
Learn how workflow dashboards give leaders real time execution visibility, improve workflow transparency, identify bottlenecks early, and strengthen decision making without micromanaging teams.
Executive Summary
Many leadership teams struggle to answer a simple question: How is execution really progressing?
Project updates often present completed tasks, milestone dates, and overall status. While this information is useful, it rarely explains whether work is flowing efficiently, where delays are forming, or which risks are likely to affect future outcomes.
This lack of execution visibility forces leaders to rely on assumptions, frequent status meetings, or direct requests for updates. As organizations grow, these approaches become increasingly ineffective. Leaders spend more time collecting information and less time making informed decisions.
Workflow dashboards provide a better approach. When designed correctly, they help leaders understand how work moves across teams, identify emerging bottlenecks, recognize delivery risks early, and improve organizational alignment without increasing oversight or creating unnecessary reporting.
This article explains how workflow dashboards support leadership visibility, what information executives should monitor, and how Execution Clarity helps organizations turn operational data into better business decisions.
Why Leadership Visibility Breaks Down as Organizations Grow
Most organizations begin with relatively simple communication structures. Team members know who owns each initiative, leaders have direct access to project updates, and decisions move quickly.
Growth changes this dynamic.
As organizations expand, they introduce more teams, additional priorities, larger portfolios, and greater operational complexity. Information becomes distributed across multiple systems, meetings, and reporting formats.
Leaders may receive regular updates, yet still struggle to answer questions such as:
- Which initiatives are slowing down?
- Which dependencies present the greatest risk?
- Where are decisions waiting?
- Which teams are overloaded?
- Which projects require leadership attention today?
The issue is rarely a lack of information.
The issue is that information exists in many different places and often focuses on activity rather than execution.
Execution visibility depends on understanding how work progresses across the organization instead of simply measuring completed tasks.
What Is Execution Visibility?
Execution visibility is the ability for leaders to understand how work is progressing across the organization in real time.
It helps leaders answer three critical questions.
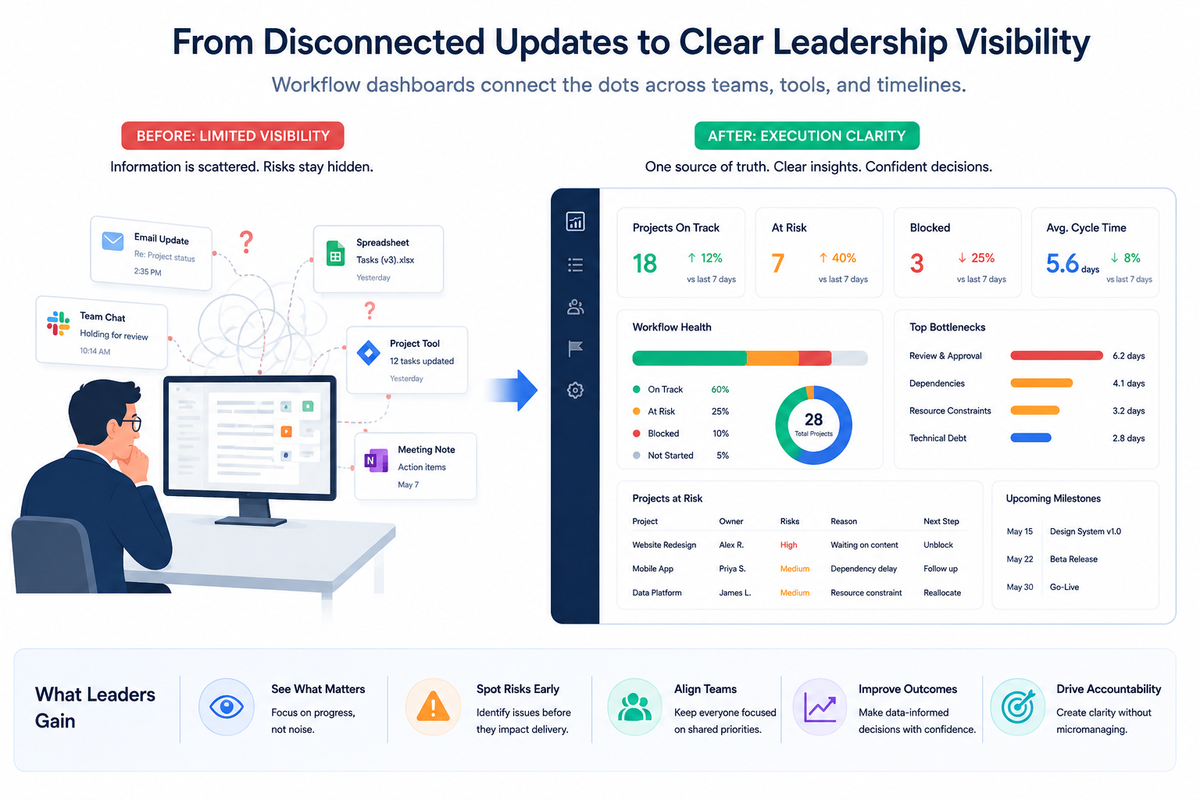
What is happening?
Leaders need a clear view of work moving through different stages, current priorities, and emerging constraints.
Why is it happening?
Visibility should reveal the factors affecting delivery, including delayed decisions, competing priorities, resource constraints, communication gaps, and cross functional dependencies.
What should improve next?
Effective visibility highlights the operational improvements most likely to strengthen delivery performance and organizational outcomes.
This is the foundation of Execution Clarity.
Why Traditional Project Reporting Falls Short
Most organizations already have project management tools.
The problem is not a lack of software.
Traditional reports often emphasize completed work instead of execution health.
For example, a project may appear on schedule while several critical dependencies remain unresolved.
A milestone may show as complete even though downstream teams have already begun experiencing delays.
Leadership needs information that explains execution rather than simply documenting activity.
Workflow dashboards help bridge this gap.
What Makes a Workflow Dashboard Valuable?
A leadership dashboard should help executives recognize patterns instead of reviewing isolated metrics.
Effective workflow dashboards provide visibility into several areas.
Work Flow Across Teams
Leaders should understand how initiatives move between business functions.
This improves team collaboration by making dependencies more visible before they become delivery risks.
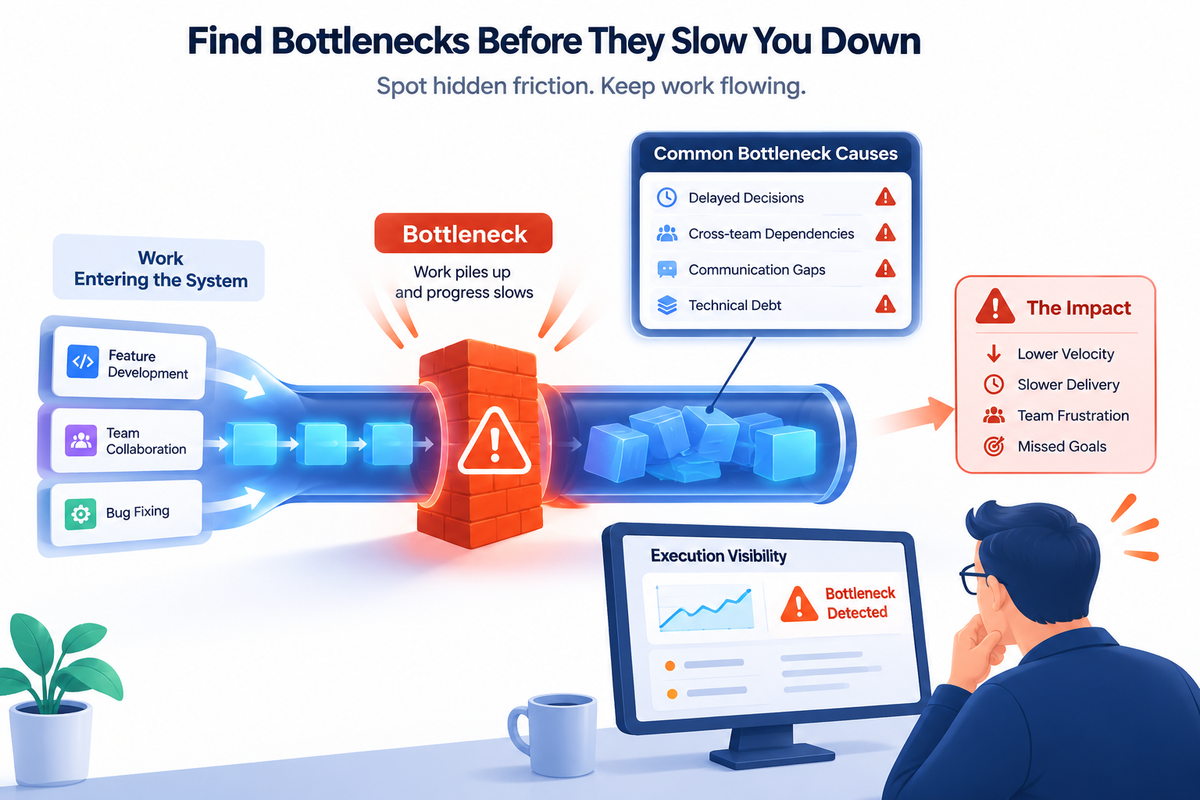
Bottlenecks
Every organization experiences constraints.
The goal is to identify them early enough to reduce their impact.
Dashboards should highlight where work accumulates, where approvals slow progress, and where teams consistently wait for external input.
Decision Delays
Many execution challenges result from decisions that remain unresolved.
Visibility into pending approvals allows leaders to intervene before schedules begin to slip.
Capacity Trends
Teams may appear productive while operating beyond sustainable capacity.
Workflow transparency helps leaders balance workloads before burnout and delivery issues emerge.
Delivery Confidence
Rather than focusing only on completed tasks, dashboards should indicate whether current execution patterns support predictable outcomes.
This gives leaders a stronger foundation for planning and forecasting.
How Workflow Dashboards Improve Leadership Oversight
Leadership oversight should enable better decisions rather than closer supervision.
Well designed dashboards reduce uncertainty without encouraging unnecessary involvement in daily work.
They allow leaders to identify operational risks while giving teams the autonomy to manage execution.
Organizations that improve execution visibility often experience several benefits.
- Faster decision making
- Better organizational alignment
- Earlier identification of delivery risks
- More consistent prioritization
- Stronger accountability
- Greater confidence in forecasting
- Improved operational efficiency
These improvements strengthen leadership without creating additional reporting work.
A Practical Framework for Using Workflow Dashboards
Many organizations build dashboards that contain dozens of charts but provide little guidance.
A more effective approach follows a structured process.
Step 1
Define the business outcomes that matter.
Examples include improving release predictability, reducing delivery delays, increasing customer satisfaction, or accelerating strategic initiatives.
Every dashboard should support measurable business objectives.
Step 2
Map how work moves through the organization.
Identify each stage where projects move between teams.
This reveals where delays commonly occur and where additional visibility is needed.
Step 3
Monitor execution instead of activity.
Measure factors such as waiting time, dependency health, decision speed, and work flow stability.
These indicators reveal execution quality more effectively than task counts alone.
Step 4
Review trends instead of isolated events.
One delayed project may not indicate a systemic problem.
Recurring delays across multiple initiatives often reveal deeper operational issues.
Dashboards should help leaders identify these patterns.
Step 5
Take action early.
The greatest value comes from identifying risks before delivery commitments are affected.
Early intervention reduces disruption and improves long term performance.
Common Mistakes Organizations Make
Many workflow dashboards fail because they emphasize reporting instead of decision support.
Common mistakes include:
- Displaying too many metrics
- Measuring activity instead of outcomes
- Ignoring cross functional dependencies
- Updating dashboards infrequently
- Creating reports that only project managers use
- Failing to connect operational data with business objectives
Leadership dashboards should simplify decision making rather than increase information overload.
How Execution Clarity Strengthens Workflow Transparency
Workflow dashboards provide valuable operational insight.
Execution Clarity provides the broader context leaders need to understand what those insights mean.
Execution Clarity helps organizations connect workflow transparency with strategic outcomes by answering three essential questions.
What is happening?
Why is it happening?
What should improve next?
Rather than reacting after delivery problems become visible, leaders can identify risks earlier, prioritize improvements more effectively, and strengthen execution across the organization.
The result is greater confidence in planning, stronger alignment across teams, and more predictable business performance.
Recommended Actions
Organizations seeking stronger execution visibility should begin with several practical improvements.
Review whether leadership dashboards explain execution or simply report activity.
Identify recurring bottlenecks that affect multiple initiatives.
Improve visibility into cross functional dependencies.
Measure operational trends over time instead of reviewing isolated project updates.
Use workflow transparency to support decision making rather than increase oversight.
Regularly evaluate whether dashboard metrics connect directly to strategic business outcomes.
These actions help leaders improve operational efficiency while creating greater confidence in execution.
Conclusion
Leadership visibility is not achieved by collecting more status reports.
It comes from understanding how work moves through the organization, recognizing emerging risks early, and making informed decisions before small issues become significant business problems.
Workflow dashboards help leaders gain that perspective when they focus on execution rather than activity.
Combined with Execution Clarity, they provide a practical foundation for improving leadership oversight, strengthening team collaboration, increasing workflow transparency, and delivering more predictable business outcomes.
Organizations that improve execution visibility are better equipped to respond to change, align teams around shared priorities, and consistently translate strategy into measurable results.
Frequently Asked Questions
What is execution visibility?
Execution visibility is the ability for leaders to understand how work is progressing across the organization, identify operational risks, and make informed decisions before delivery issues affect business outcomes.
Why are workflow dashboards important for leadership?
Workflow dashboards help leaders understand how work flows across teams, identify bottlenecks, monitor dependencies, and improve decision making without increasing day to day oversight.
How do workflow dashboards improve project management?
They provide greater transparency into work flow, resource constraints, and delivery risks, allowing leaders to address issues before they affect schedules or customer commitments.
What should a leadership workflow dashboard include?
A leadership dashboard should include information about work flow, dependencies, decision delays, capacity trends, delivery confidence, and operational risks that affect strategic execution.
What is the difference between project reporting and execution visibility?
Project reporting explains what has happened. Execution visibility helps leaders understand why work progresses as it does and where improvements should be made before outcomes are affected.
How does Execution Clarity improve leadership decision making?
Execution Clarity helps leaders understand current execution, identify root causes behind delivery challenges, prioritize improvements, and make decisions based on evidence rather than assumptions.